Viewing meeting diagnostics and call history
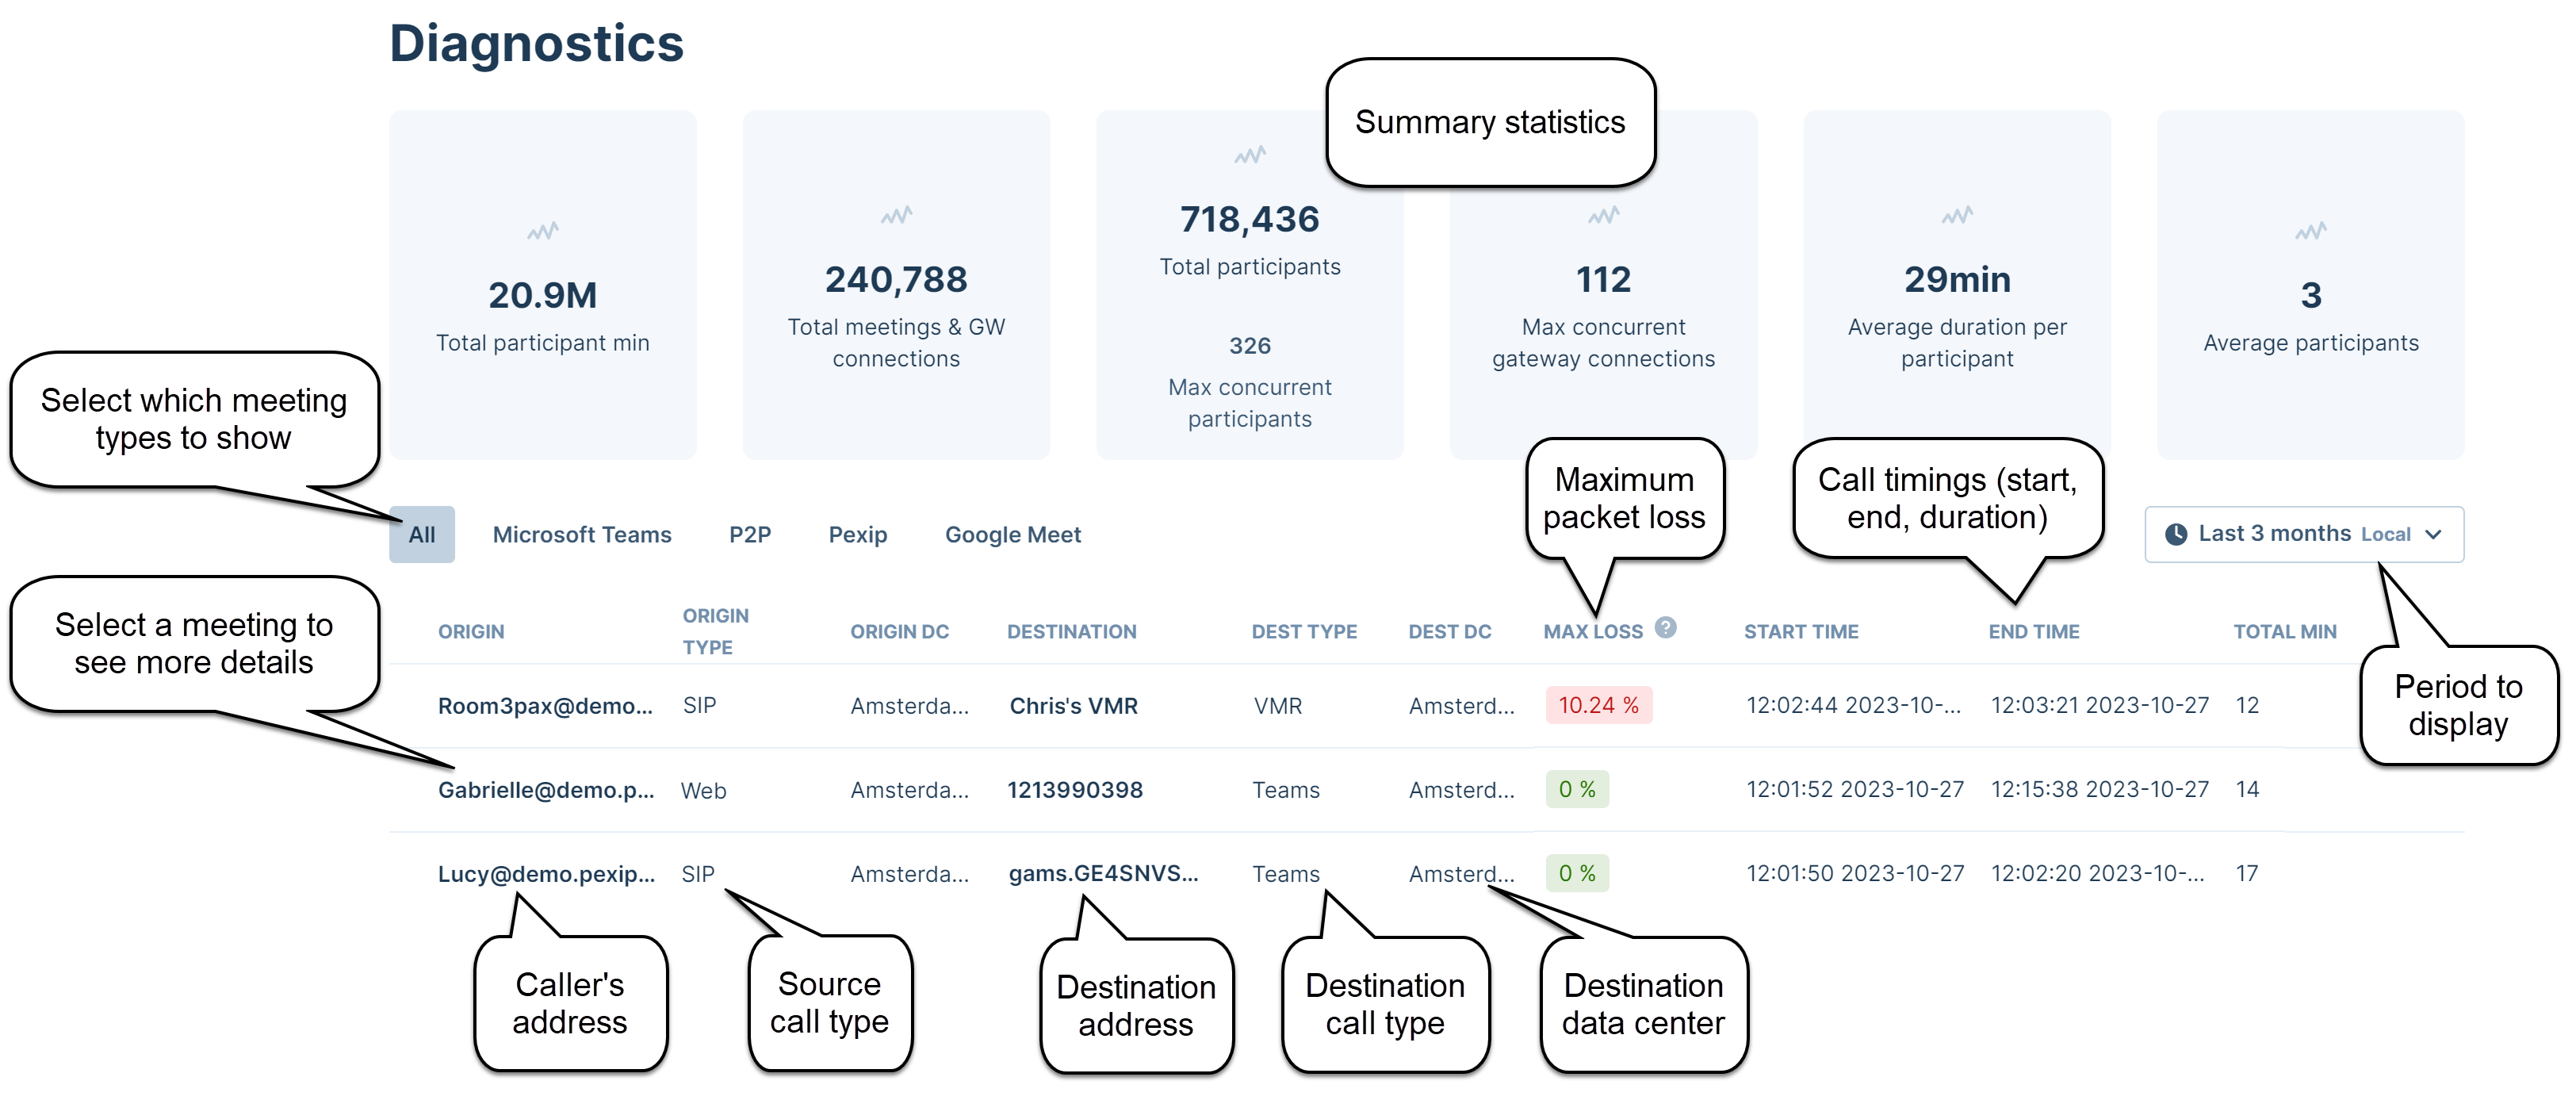
The page shows summary and detailed information for all current and historic calls and meetings.
It provides access to Call Data Records (CDRs) to identify calling trends, produce data input for reports and to assist in troubleshooting during technical faultfinding.
According to the Pexip Personal Identifiable Information (PII) data retention policy, all personal data relating to CDRs over 3 months old are anonymized or removed, and the correlation between callers and callees will be lost.
To view meeting diagnostics, go to the company whose meetings you want to view, and then select from the main menu on the left.
- At the top of the page, metrics include total participant minutes, the total number of meetings and participants present, the average duration per participant and the average number of participants.
- Diagnostics are only available to users with Admin role access. These diagnostics/CDRs can be exported in CSV format.
Viewing current and historic calls/meetings
The meetings table shows the basic information below. Just select a row to go into the details for that specific meeting. This table uses local time, not UTC.
If you do not see the live data, or you get a Trying to connect or Failed to connect message, see Safelisting firewall domains for information on how to resolve this.
Viewing call details and events
You can select any row in the meetings table to view full details of that call.
Data shown includes:
-
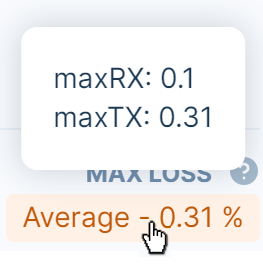
Call quality information — you can hover over the maximum packet loss to see the maximum send (maxTX) and receive (maxRX) packet loss %. Note that:
- Send and receive are from the service's viewpoint to and from the device.
-
It is the maximum value across all media streams, and covers the entire call duration.
For example, if the media statistics for packet loss are: audio: RX 1%, TX 2%, and video: RX 5%, TX 0%
then PCC shows: maxRX: 5% and maxTX: 2%.
- If a call ends or disconnects unexpectedly, the end reason is provided.
- The full source and destination names and IP addresses.
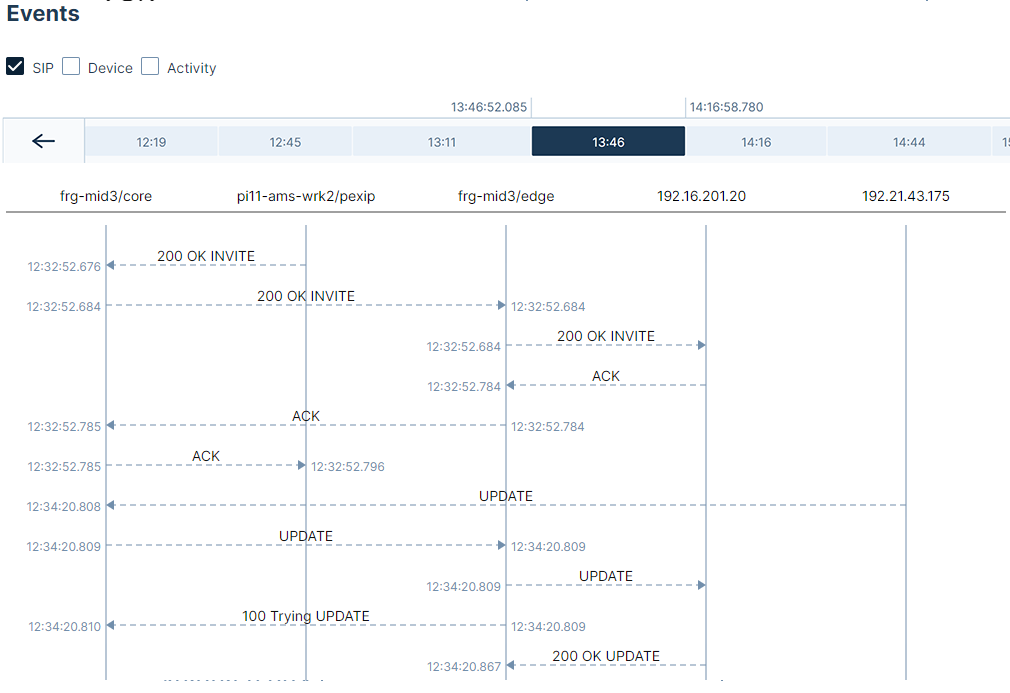
-
A full SIP ladder diagram showing all call events to assist with troubleshooting.
- You can filter the diagram by event types. These vary according to the type of call but can include SIP, Device, Activity and MMV.
- If the call has a lot of events, a timeline is displayed from where you can select the time period of the events you want to view.
- Diagnostic SIP messages are in UTC.
- You can select an event to see full logging details of that event.
Call data records (CDRs) export
You can export CDRs in CSV format from the following tables in PCC:
- Company diagnostics
- Video system diagnostics
- User diagnostics
- Room diagnostics

The following data fields are included in the export:
- ID
- Start Time (UTC)
- Duration (hours:minutes:seconds)
- Origin Display
- Origin AOR
- Origin IP
- Origin Type
- Destination Display
- Destination AOR
- Destination Type
- Destination IP
- Status Code
- Status Reason
- Max Transmit Packet Loss %
- Max Receive Packet Loss %
For example:

Note that the content of the CDRs may change in the future.