Creating and viewing diagnostic graphs
The Pexip Infinity Administrator interface includes a series of graphs that can be used to monitor the status and performance of the platform. You can view and edit the default graphs, create your own graphs, and change the order in which the various graphs appear.
To view and manage the graphs, go to .
Information shown in the graphs
The graphs show data for the selected metrics starting from either when the relevant node was created, or when it was first rebooted following a platform upgrade to version 20 or later. Further metrics may be added in subsequent releases of Pexip Infinity; when you upgrade a node, data for any newly-added metrics will be available starting from the point at which the node was rebooted following the upgrade.
If a node has been temporarily out of service at any point, there will be a corresponding gap in the graphs. This also applies to cloud bursting nodes for the times that they were not in use.
Diagnostic graphs are generated dynamically from information obtained from the relevant nodes, so the node must be currently available in order for its measurements to be shown in the graph. This means that any nodes that are currently out of service are not shown; nor are any cloud bursting nodes, unless they are currently in use.
Default graphs
Two graphs are included by default:
- Memory usage shows the memory being used by the Management Node's application and OS processes
- CPU load shows the system load on the Management Node.
Viewing and controlling graphs
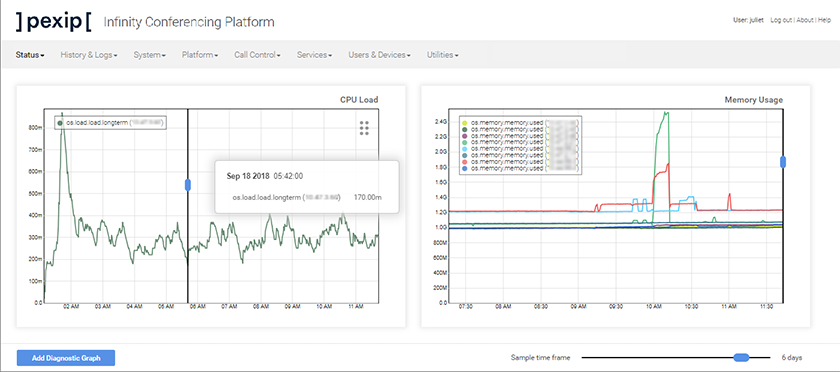
To change the time period covered by all graphs shown on the page, drag the Sample time frame control at the bottom right of the window to the left to zoom out, or right to zoom in.
To change the time period covered by an individual graph, select the blue handle on the vertical bar at the right of the graph and drag it downwards to zoom out, or upwards to zoom in. Note that in some cases after zooming in or out the lines may be cropped. To fix this, click on the line twice.
To view the values at a particular point in the graph, drag the vertical bar to the point in time you're interested in. The values at that point will appear in a pop-up next to the control.
To toggle individual lines of the graph on or off, click on them from within the legend. Those that are available but not currently showing will appear grayed out.
 icon at the top right of the graph, and drag it to the desired location.
Creating new graphs
You can create new custom graphs to add to the page. Newly-created graphs will still show retrospective information, starting from when the selected node was upgraded to version 20 or later.
- From the bottom left of the window, select .
- In the field above the new graph, enter an appropriate title.
-
From the Available nodes and Available metrics boxes below the graph, select the combination(s) you wish to appear in the graph.
- For more information on a particular metric, hover over it — the description will appear in a tooltip.
- To select multiple items, hold down the button (Windows) or button (Mac).
- The metrics that are available depend on whether the selected node is a Management Node, Transcoding Conferencing Node, or Proxying Edge Node.
- If you have selected multiple nodes, only those metrics that are common to all selected node types are available.
When you have made your selection, select .
-
The chosen combinations will appear in the Selected metrics table. From here you can refine the appearance of the graph, such as changing the color of individual lines or changing the magnification.
If a selected metric does not yet have a value (for example, if you have selected the count of node allocations and none have yet taken place), the Minimum, Average, Maximum and Last values will be blank.
- From the bottom left of the window, select .
The new graph will be added to the add to the page. Click on the graph to drag it to the desired location.
Editing and deleting graphs
To edit an existing graph, double-click it. You can then change the name, add and remove metrics, and change the appearance of the graph in the same way as when creating a new graph. When you have finished, from the bottom left of the window select .
To delete a graph, double-click it. From the bottom right of the window, select .